Hakiem Hanif
Come April, earnings season is in full swing at the CSE. Most listed companies in Sri Lanka close their books on the 31st of March, and release their Annual Reports over the next few months.
April also brought good news to the ears of investors, since the Government managed to negotiate a $1.5 billion Extended Fund Facility (EFF) from the IMF. The funds will help the country tackle its fiscal issues.
Here’s a quick rundown of how the CSE fared in the month of April.
- The ASPI gained 7.32%, while the S&P SL20 gained approximately 7.21% during the month. Thanks to this, the market capitalisation of the CSE climbed to Rs. 2.7 trillion, an increase of almost Rs. 200 billion compared to the beginning of the month.
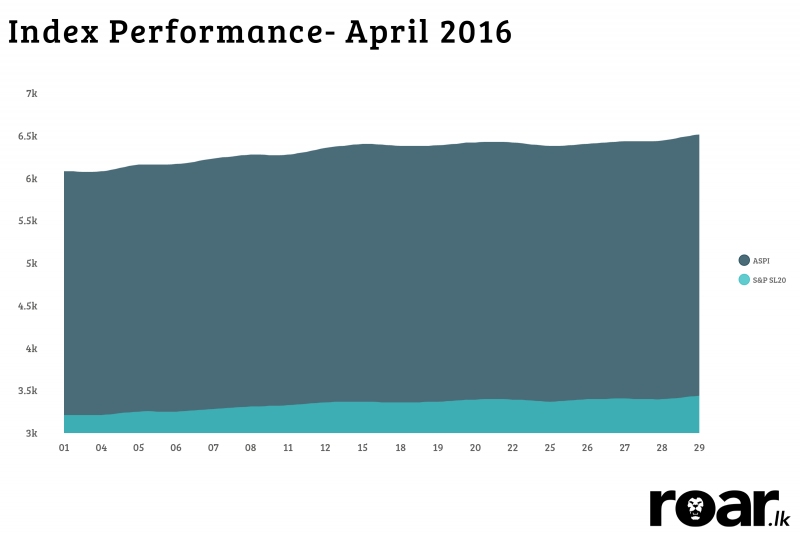
CSE Index Performance ‒ April 2016
- Interestingly, everybody except Local Institutional Investors decided to cash out during the month. It is pretty tough to put a finger on the reason, but it is most likely because of profit taking during the earnings season.
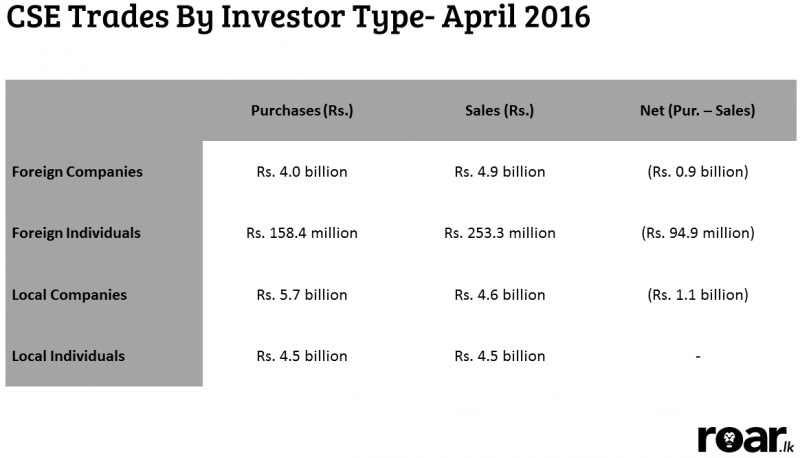
Trades by Investor Type
- Last month, we promised to talk about the CSE going live with the Global Industry Classification Standard (GICS). As its name implies, GICS is an industry classification standard developed by Morgan Stanley Capital International (MSCI), together with Standard & Poor’s, for use by the international financial community. GICS is the standard classification method employed by almost all stock exchanges, and thus, makes it easier for investors to compare companies across industries. For a more in-depth breakdown, click here.
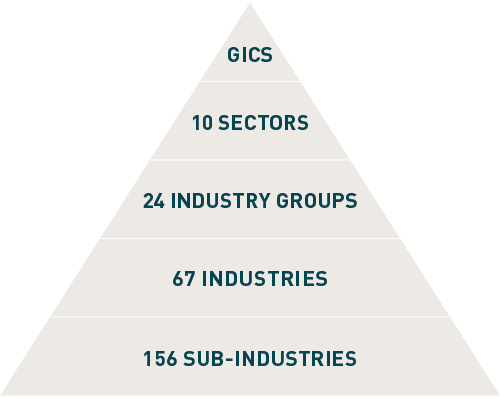
How GICS is broken down. Image credit: MSCI
That’s all from us, for now. Do check back for next month’s edition!
The comments, opinions and analyses presented herein are for informational purposes only and should not be considered individual investment advice or recommendations to invest in any security or to adopt any investment strategy. Always seek independent advice.
Featured image courtesy realtimedatasolution.com