Sakeena Razick
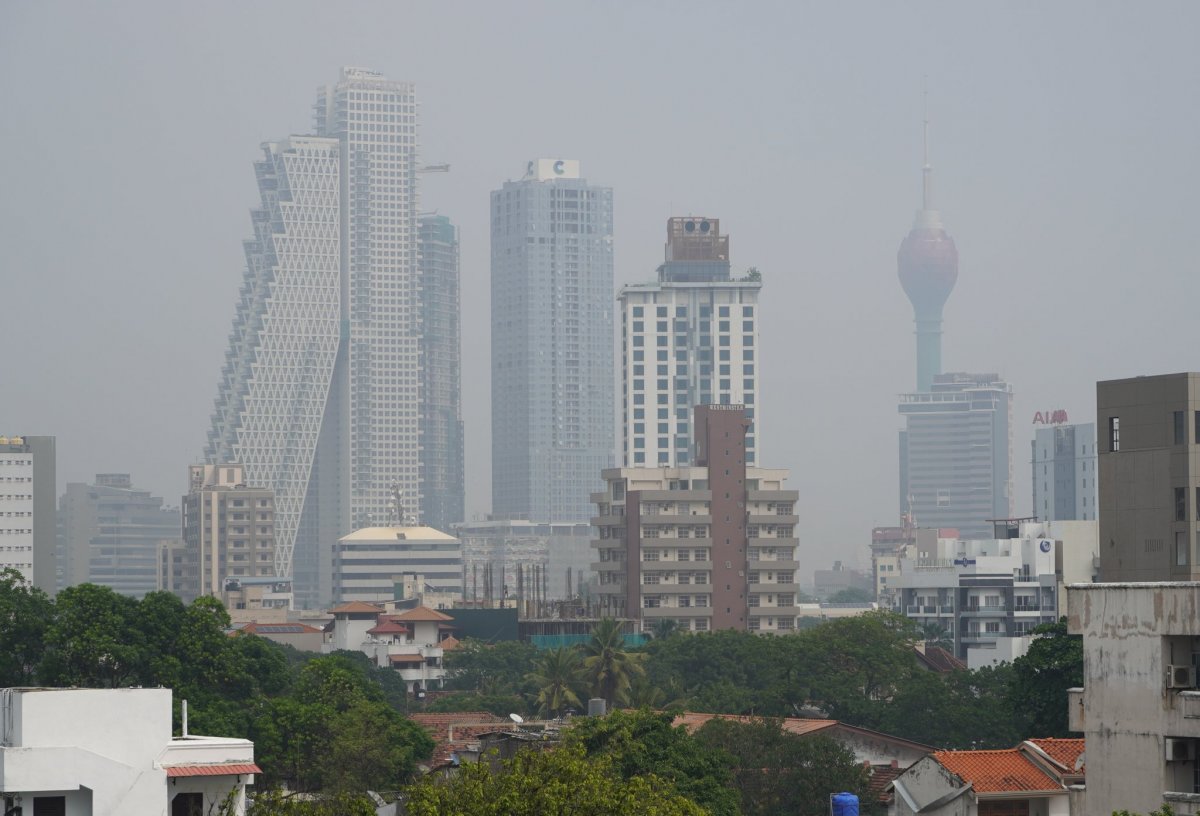
Early last November, Colombo woke up to an unusual smog lingering over the city. At first, many thought it was a mist brought about by the impending cold weather. But by late morning, news had begun to filter through that Sri Lanka’s air quality had turned ‘unhealthy’.
Wherefrom, This Smog?
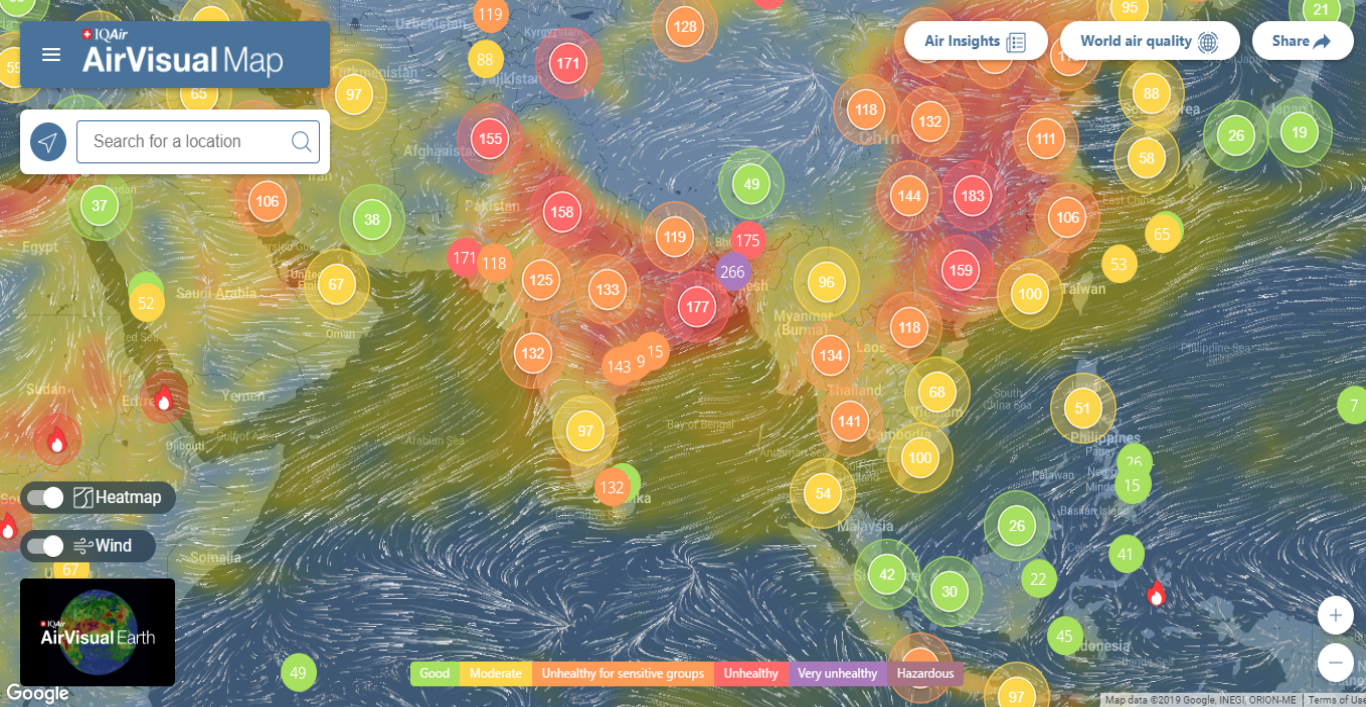
Almost as widespread as the smog was the rumour it came from Delhi, India. But although almost half the 50 most polluted cities in the world are in India, there was no proof for this.
“The analysis required to examine transboundary air pollution and its effects are quite complex,” Environment Researcher at Verité Research Ashani Basnayake told Roar Media.
As a result, it is difficult to say how much of Sri Lanka’s smog is a direct consequence of this.
How Is The Air Polluted?
Air pollution kills an estimated seven million people every year. Particle pollution or Particulate Matter (PM), a mixture of liquid droplets and extremely small particles are found in varying sizes in the air, and can include dust, soil, metals, and acids. Larger PM can be visible to the eye, while smaller PM—2.5 micrometres or less in diameter (and 40 times smaller than the width of an average human hair)—can only be detected through a microscope.
“Smaller particles are worse because it can travel more than 5,000 km with wind due to its size,” Senior Scientist at the National Building Research Organization (NBRO) Air Quality Unit, Sarath Premasiri explained. “These are the particles that easily enter the respiratory system.”
Particle pollution contributes to respiratory illnesses such as asthma and bronchitis, and some studies have even linked it to cancer. These tiny particles also enter the bloodstream and can reach vital organs such as the brain, kidney and liver.
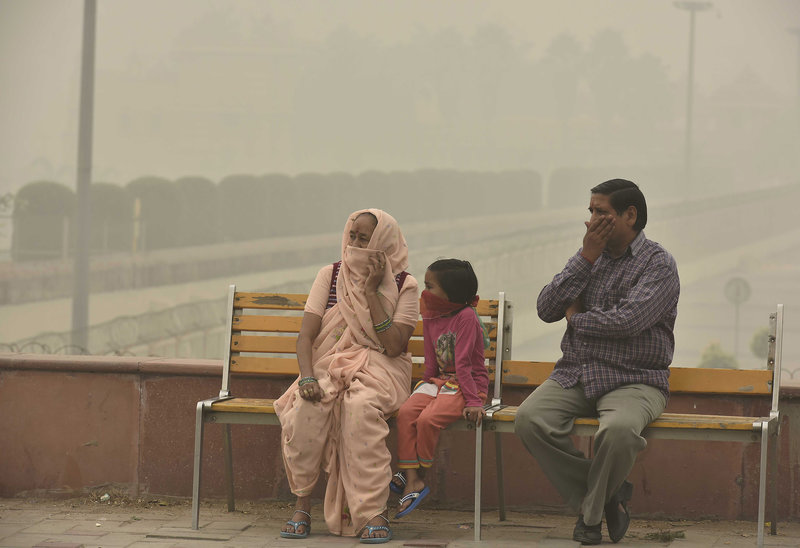
Photo Credits: Raj K Raj/Hindustan Times/Getty Images.
How Does Sri Lanka Measure Air Quality?
The primary state institutions responsible for measuring air quality in Sri Lanka are the Central Environmental Authority (CEA) and the NBRO. Sri Lanka has five state-owned air quality monitors capable of providing real-time data. The NBRO has one stationed at the Meteorological Department and one in Battaramulla. In 2018, the CEA introduced special automated monitors in Battaramulla and Kandy, and one mobile monitor that is stationed in various parts of the city.
According to the NBRO, last month, monitors were also placed in a few places out of Colombo, such as Jaffna, Galle, Anuradhapura, Puttalam, Kurunegala, and Vavuniya. But, in general, an air quality monitor covers a radius of not more than 100 metres.
There are also three other privately-owned monitors stationed in Colombo and its suburbs, and these include the one at the U. S. Embassy, which took the lead in disseminating information about the quality of air in Colombo when the smog took over—in turn raising valid questions about the utility of state-operated systems.
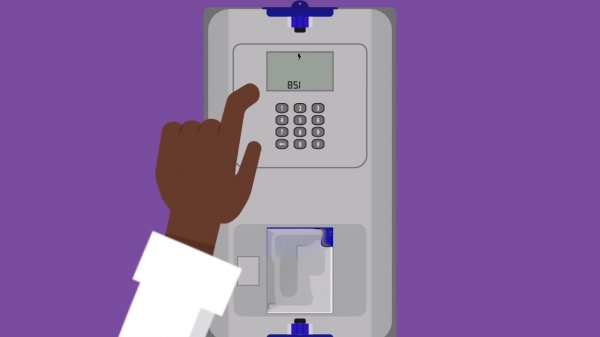
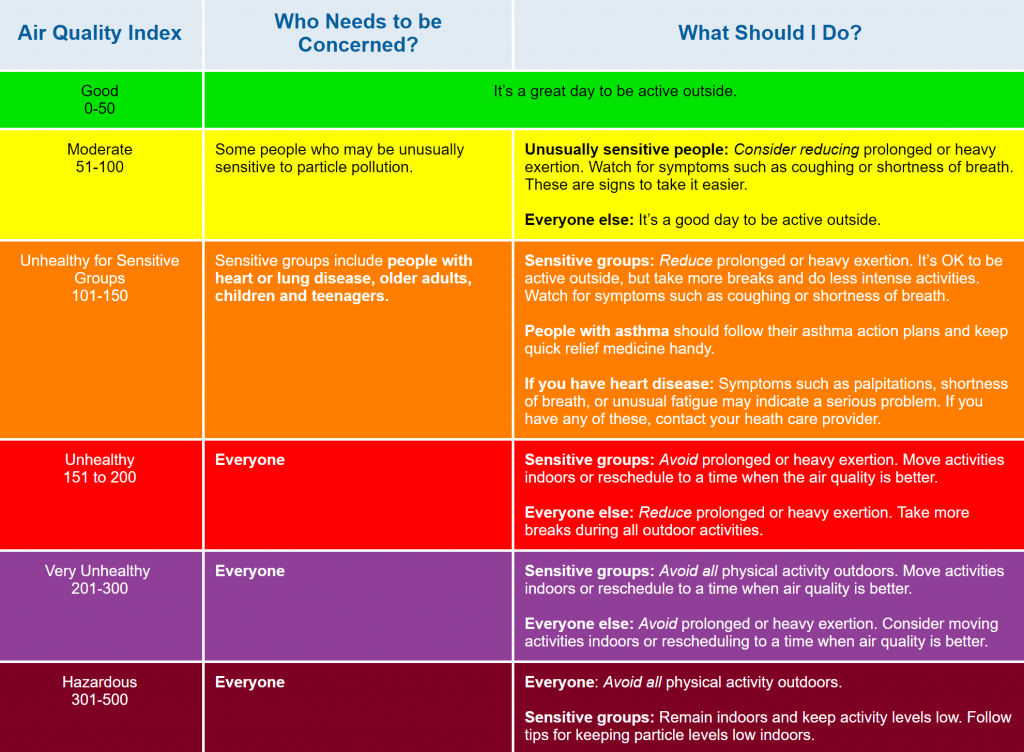
Air quality is measured against an Air Quality Index (AQI), where, like with a thermometer, the degree of air pollution is marked on a scale. It can range from 0-50, which is ‘good’ or go up to beyond 300, the dark, ‘hazardous’ zone.
The World Health Organization (WHO) estimates that more than 80% of people living in urban areas—where air pollution is mostly monitored—are exposed to levels that exceed WHO guideline limits. And in Sri Lanka, the national standard of what is hazardous air is lower than international.
“For example, the US standard is 35 micrograms [of PM 2.5] per cubic metre air for 24 hours. In Sri Lanka it is 50 micrograms per cubic metre,” Premasiri told Roar Media.
These standards refer to minimum levels of air pollutants during a specified time in a defined area. And globally, the levels of 2.5 PM allowed are even stricter, with WHO guidelines standing at 25 micrograms per cubic metre air of fine particulate matter.
“AQI values are categorised depending on the health conditions of the country,” Premasiri explained. “It is a kind of prediction based on our [health] standards.”
“Since this is a health concern, it is better for us to go with the US standard. We are also working on some research, but we have not exactly calculated air quality index levels for Sri Lanka. We have to do a lot of health studies to develop a good air quality index,” he said.
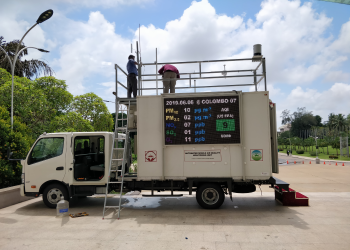
Photo Credits: NBRO
Is Sri Lanka’s Air Polluted?
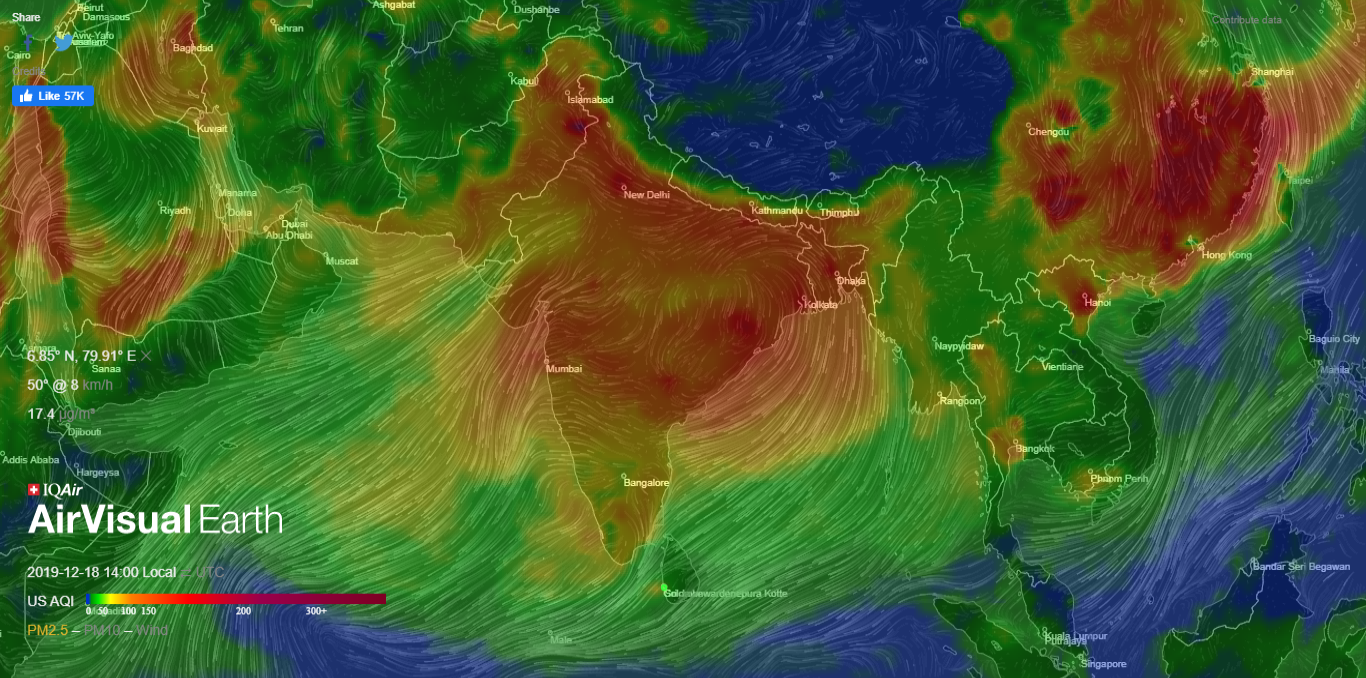
During the smog, the NBRO’s analysis depended mostly on judging wind patterns. “We can’t identify where it is coming from, but depending on the wind direction, we [can]have to assume,” Premasiri said.
“The highest levels of wind came from the North of the country and at that time India too had high pollution levels.”
Premasiri explained that looking at more rural areas that generally maintain a ‘good’ level of air quality was also an indicator. “If those areas get highly polluted along with the other areas, then we can assume that it has come from an external source,” he said. On November 6th, the effects of Sri Lanka’s smog were also reported in the Northern and North-Western provinces.
However, Premasiri emphasised that in Sri Lanka’s instance, blame cannot simply be attributed to India, and could be a mix in the atmosphere. The Northeast monsoon (December-February), he said, also contributed, with dry weather and low pressure circulating pollution at ground level, for long periods of time.
“The most common pollutants in Sri Lanka are vehicular emissions, domestic and commercial activities such as open burning, generators, and industrial boilers, and coal and thermal power plants,” he said.“More than 60 percent [of average pollution] is due to vehicles and domestic emissions. The other 30-40 percent are other sources.”
How Must We Tackle This?
The NBRO has assured the public that the situation will improve with the inter-monsoon season of March. But this highlights the fact that this is simply a temporary solution. In order to identify polluted air and keep track of areas that violate standards, air quality must be systematically monitored. This information helps identify the causes of pollution and push for policies and regulations to curb bad air. Most importantly, it helps keep the public informed of when air contamination can have adverse effects on human health.
But according to Basnayake, Sri Lanka does not have an effective platform overseeing all monitors, and neither is the data accessible to the public.
Premasiri pointed out that bad air quality had prevailed even last year. But a lack of funding to maintain continuous management and obtain a quick analysis of information consistently gets in the way.
“We just didn’t have facilities to measure continuous data,” he said. “But, we must think about air pollution as a critical problem in Sri Lanka.”
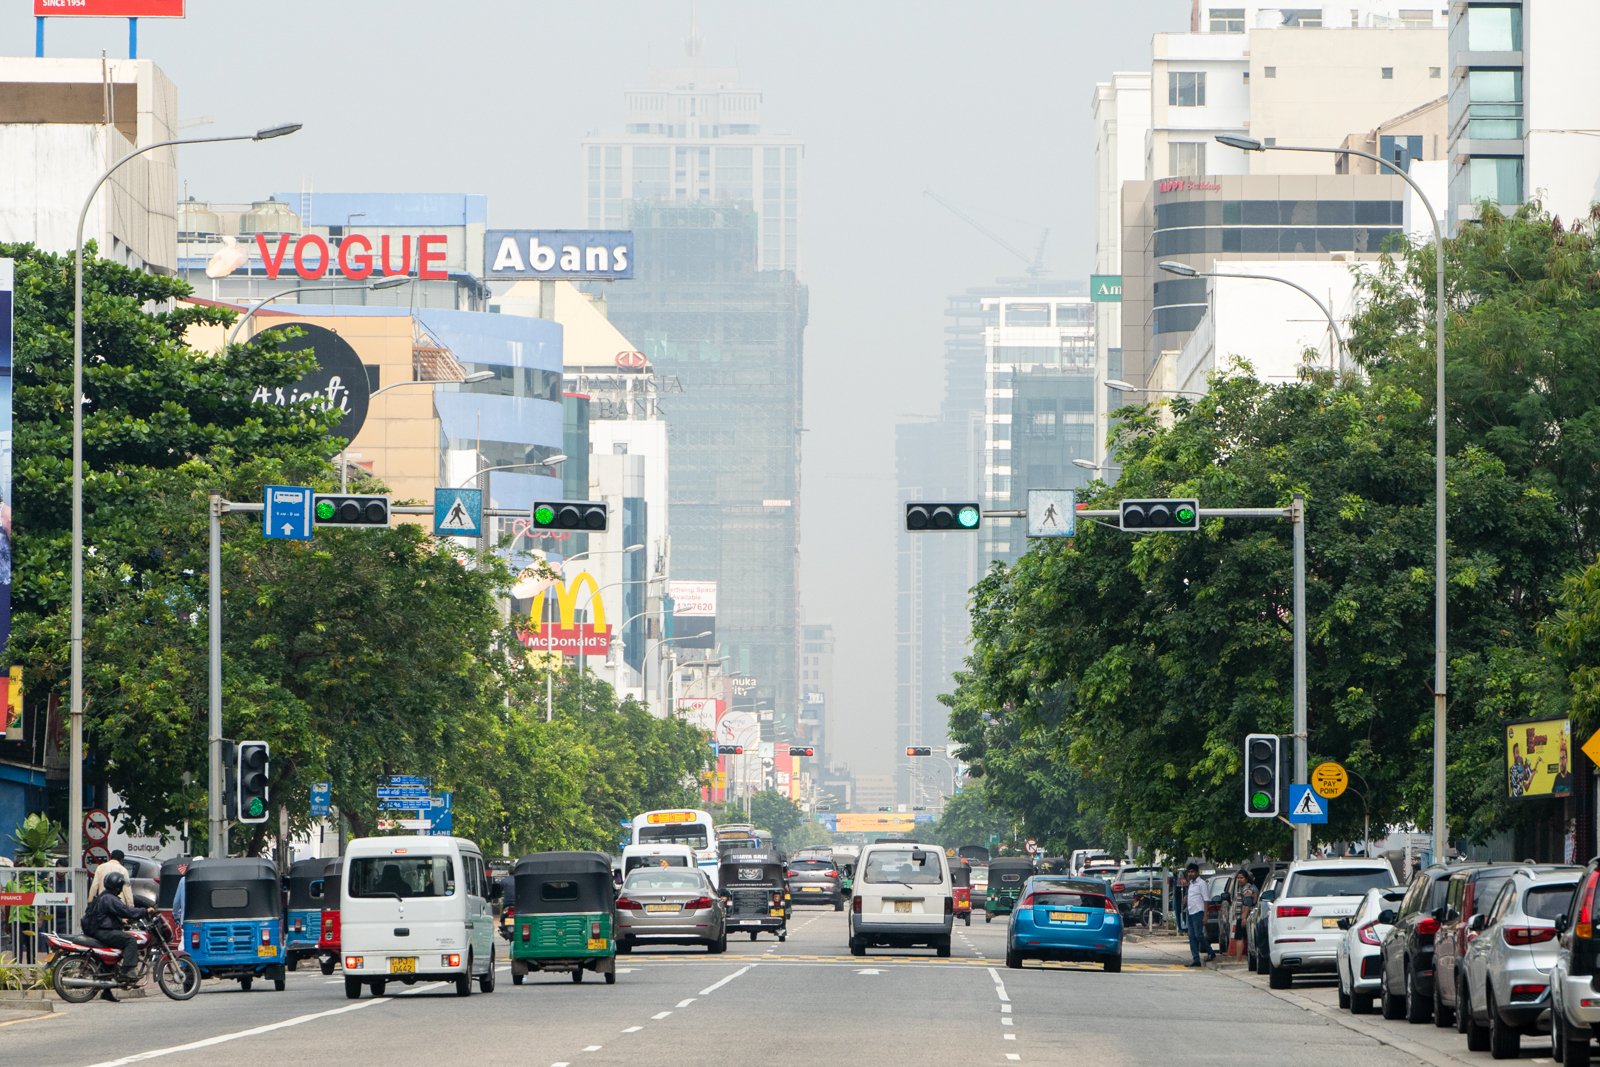
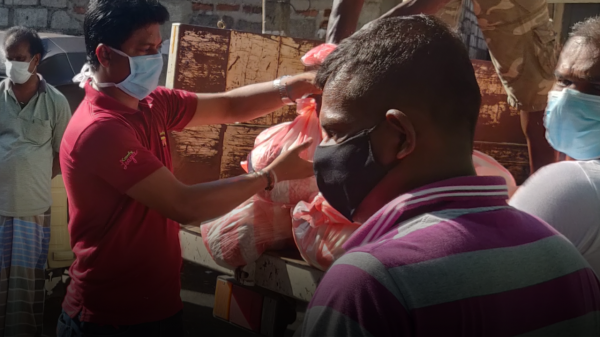
Photo Credits: Roar Media/Nazly Ahmed