Malinda Samarasinghe
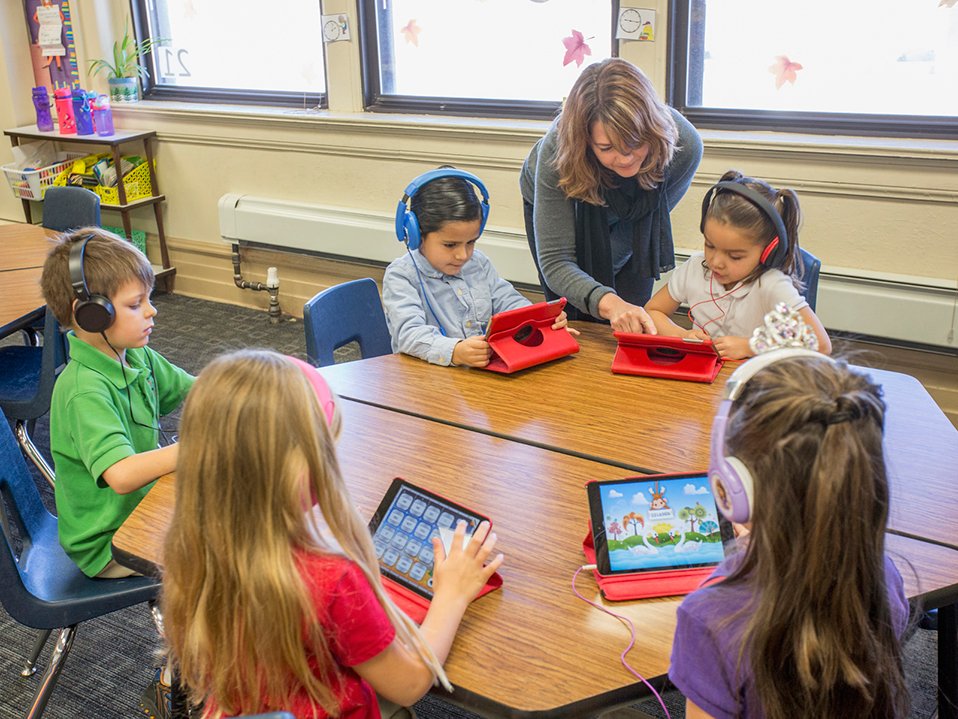
The opinions expressed in this article are those of the author’s and do not necessarily reflect the views of Roar Media.
Analytics to improve the learning experience of students in Sri Lanka
If you run a google search for the title above, you’ll get quite a lot of results. Most of them talk about how technology is largely being used for education and how data created through these devices can be used for insights.
The moment we read the word analytics or the phrase “data-driven”, we immediately think about algorithms, data warehouses, big data, machine learning and AI.
This thinking is completely wrong.
Being data-driven means making sure progress will be transparent and measurable.
Making things transparent and measurable is the first step towards fixing any problem., It allows us to:
- Identify the problem
- Identify the most influential factor of the problem
- Experiment and test actions to fix the problem
- Implement the most impactful actions to fix the problem
You can be data-driven with just a pen, paper, and minimal effort. You don’t need all the other jargon to get started.
Let’s jump right into the steps.
- Find a metric that represents an entire sector
The metric that parents and teachers use to measure education is the academic performance of students. But what is the most important factor for a student’s academic performance?
Click here to contribute if you got suggestions, we would love to hear your thoughts.
“The emotional connections students foster in their classrooms are likely to impact their success in school,” the Journal of Educational Psychology states.
How do you gauge emotional connection and is to possible to quantify it? Or can we measure lack of emotional connection instead?
It is clear that students who do not share an emotional connection with the other students in the classroom are relatively lonely. If we can find the number of lonely students in a classroom, we have cracked this.
The Number of Lonely Students (NLS) is a good representation of the emotional connection students foster in their classroom. Lower NLS shows that there is a higher emotional connection among students, making it easier for the entire classroom to be engaged in the learning experience.
But how can we quantify the Number of Lonely Students (NLS) in an easy manner?
- Make everything easily measurable
Distribute a small paper with the following two questions:
- Name four friends that you would like to sit with next week (this can be accommodated if possible)
- Who do you think was the exceptional classroom citizen in the last four days?
Once you start mapping this data for a few weeks you start seeing a few patterns and glean some insights.
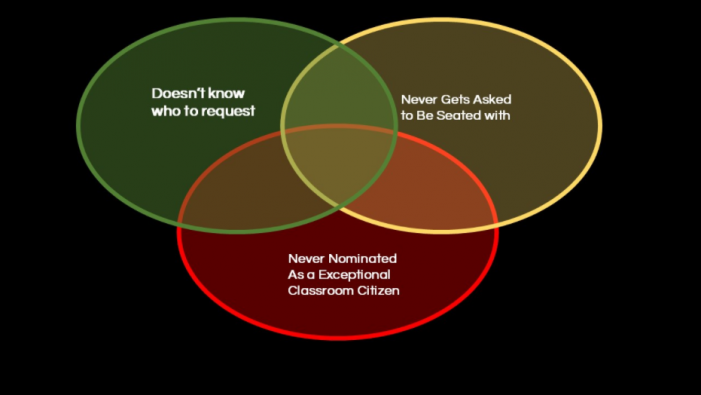
- There are some students who never get asked to be seated with by anyone
- There are also students who don’t know who to request for
- There are students who never get nominated as exceptional classroom citizens
You notice that there are a few students who fall into these three categories. They are the lonely ones.
Frankly, I would have never been nominated as an exceptional classroom citizen. Where do you think you fall?
Have you got better questions that you think might help us quantify the classroom experience? Click here to contribute.
- Ensure information is accessible and transparent
Google is doing an amazing job at facilitating this. Create a shared google sheet without any student personal information. If you want to visualize this data for easier consumption, create a simple chart.
If you are an analytics nerd like myself, you can easily create a dashboard in the data studio. It will look much nicer.
- Action the insight
It is clear that if we can bring down the number of lonely students in a classroom, we can improve the academic achievement of the overall class.
What are the activities we can do to make class more inclusive?
During my time as a maths teacher in a high school, I used quick competitions, quizzes, and projects on the presence of mathematics in nature, etc.
This is super fun and easy.
It easier to make an impact than we think.
- Make it inclusive
If we really want to progress fast, we need to learn from each other.
You can create a simple google sheet with columns for Insight, Action, and Impact. Since we are measuring the number of lonely students on a weekly basis, we can easily identify actions that impact our key metric.
Google Sheets will help you get started. Once you start scaling, you might have to look at better alternatives.
There are probably more interesting ways to make the classroom inclusive. Have you come across any tricks? Click here and add it to the common Google sheet.
This is nothing new or complex. All we have to do is identify a metric (a certain point of view) and be methodical.
Making efforts measurable will make it transparent. Transparency helps us understand what’s going right and what areas need improvement. Take the learning from what is going right and apply it to the areas that need improvement.
We believe this thought process of making things measurable, transparent, and inclusive can eventually help us to improve the education experience of Sri Lankan students; maybe even of the world if we are lucky! All it needs is some focused effort.
Click here to keep in touch with us. Let’s figure out how best we can improve the classroom experience of our students.
Cover image courtesy Edutopia